Understanding Air Quality in the Workplace

Analysis and design strategies to reduce health risks

Air Quality

The COVID-19 pandemic has brought concerns about indoor air quality and ventilation to the forefront. In 2021, we teamed up with Steelcase to explore strategies for the design and layout of a typical office space in order to promote a healthy indoor environment.

Research Facts
  • Collaborators Steelcase
Research Facts
  • Collaborators Steelcase

The “invisible” office

A healthy workplace is about more than function and aesthetics. Our team of architects and engineers has spent years studying an “invisible” aspect of the spaces where we live and work: indoor air quality. 

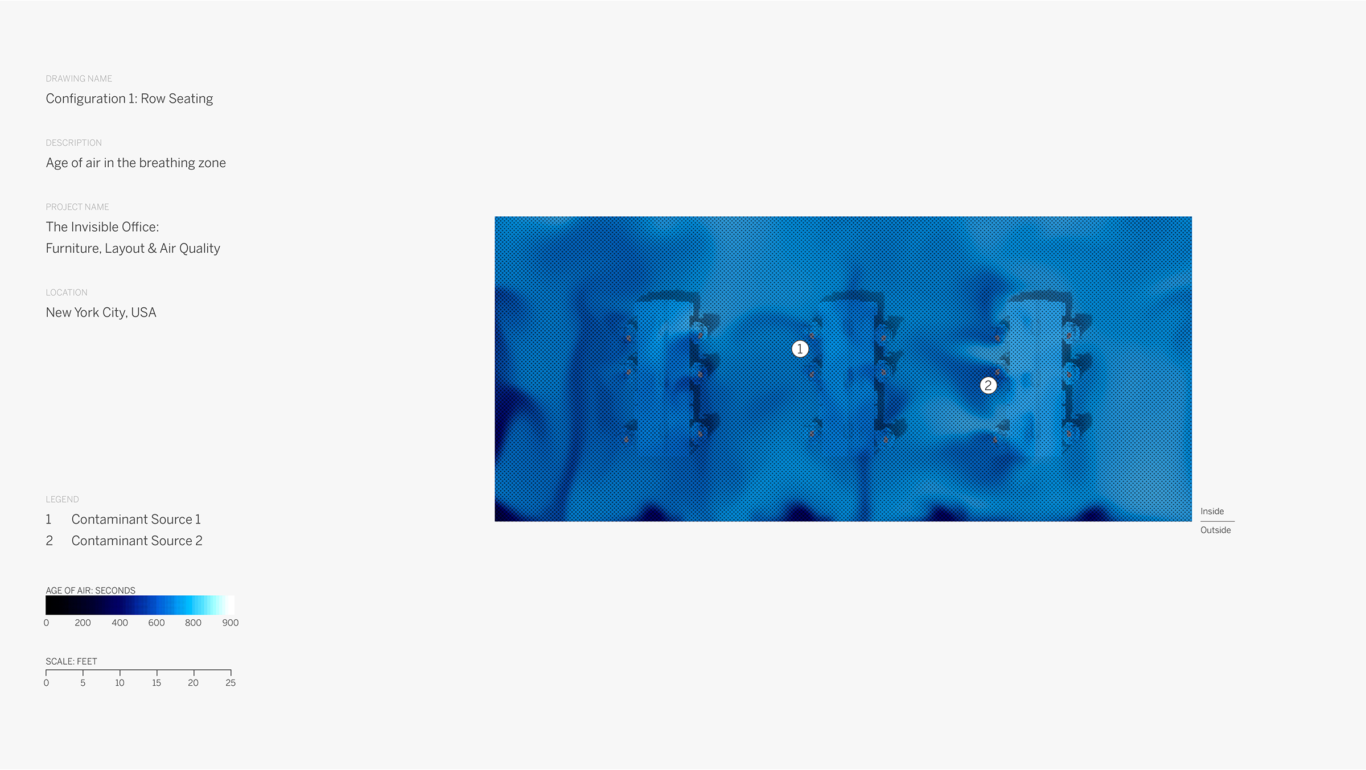
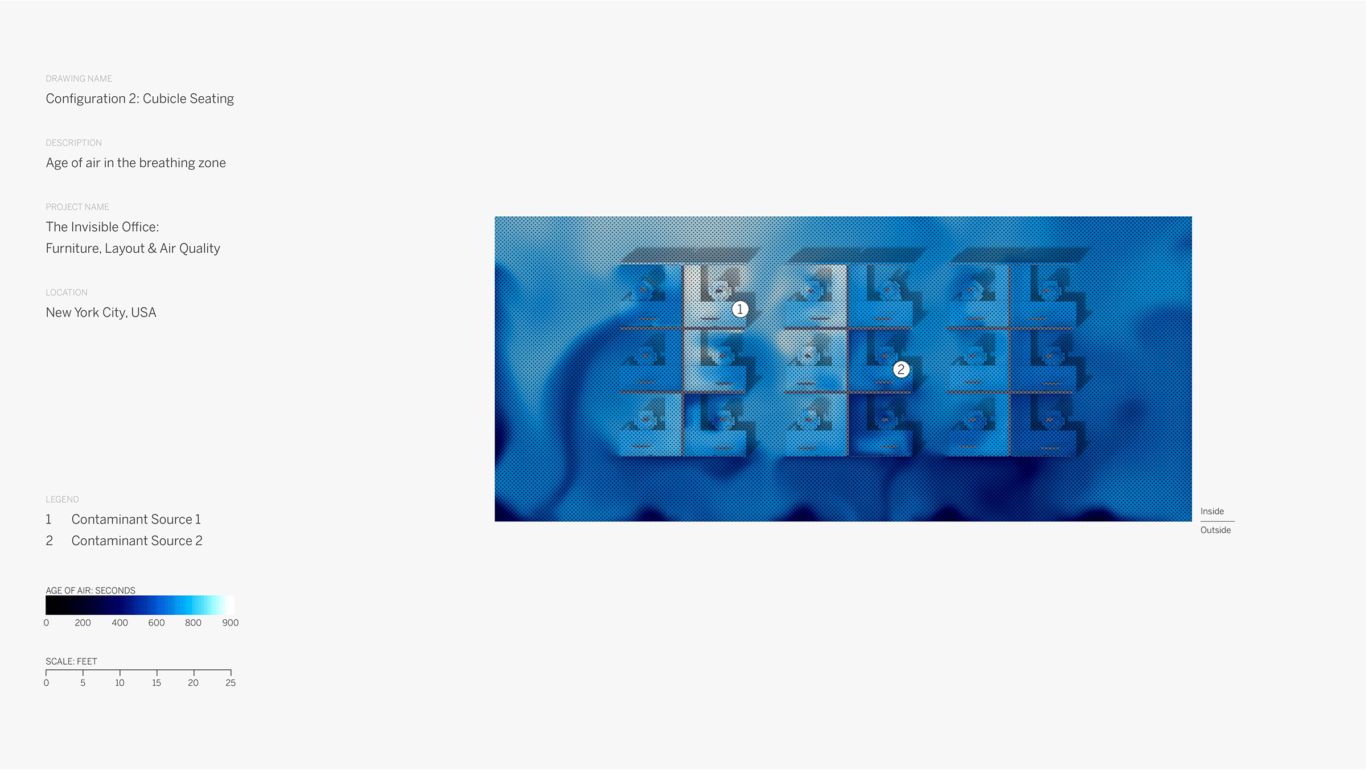
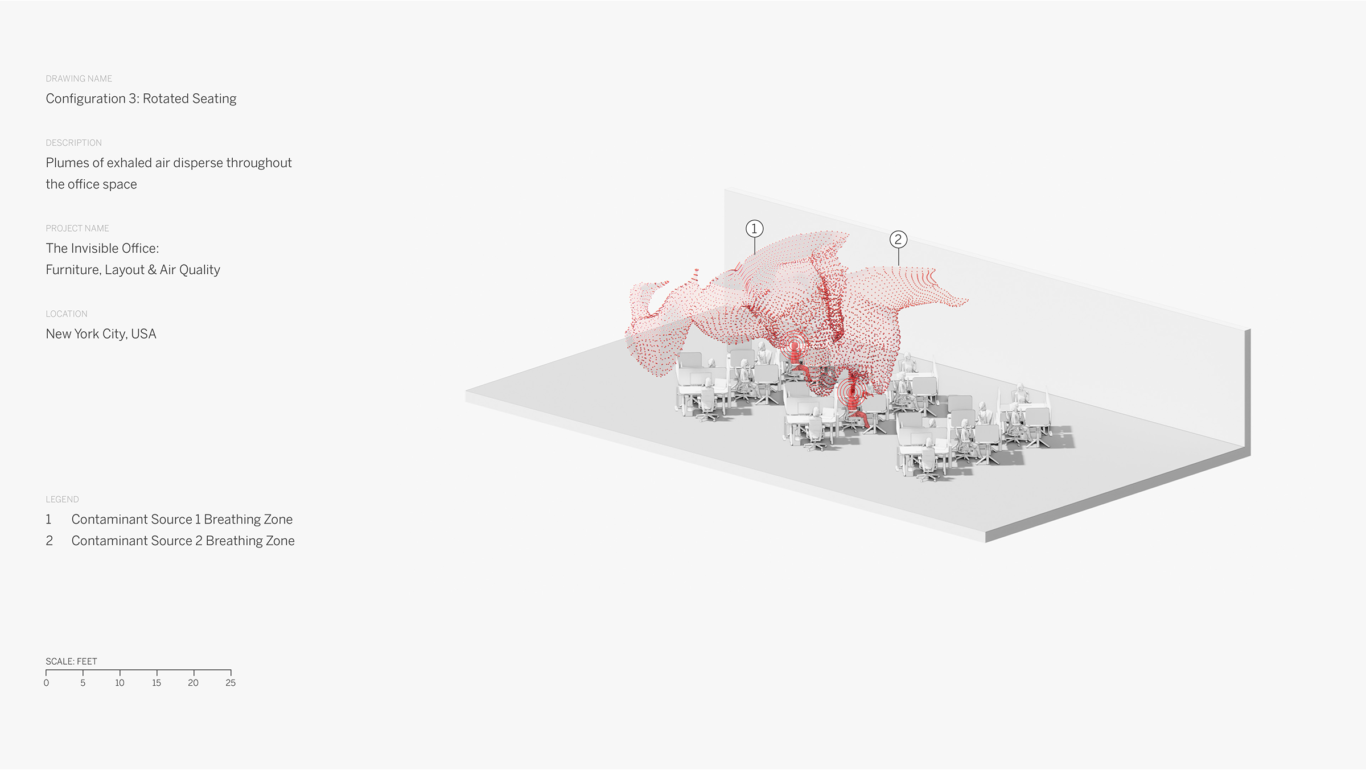
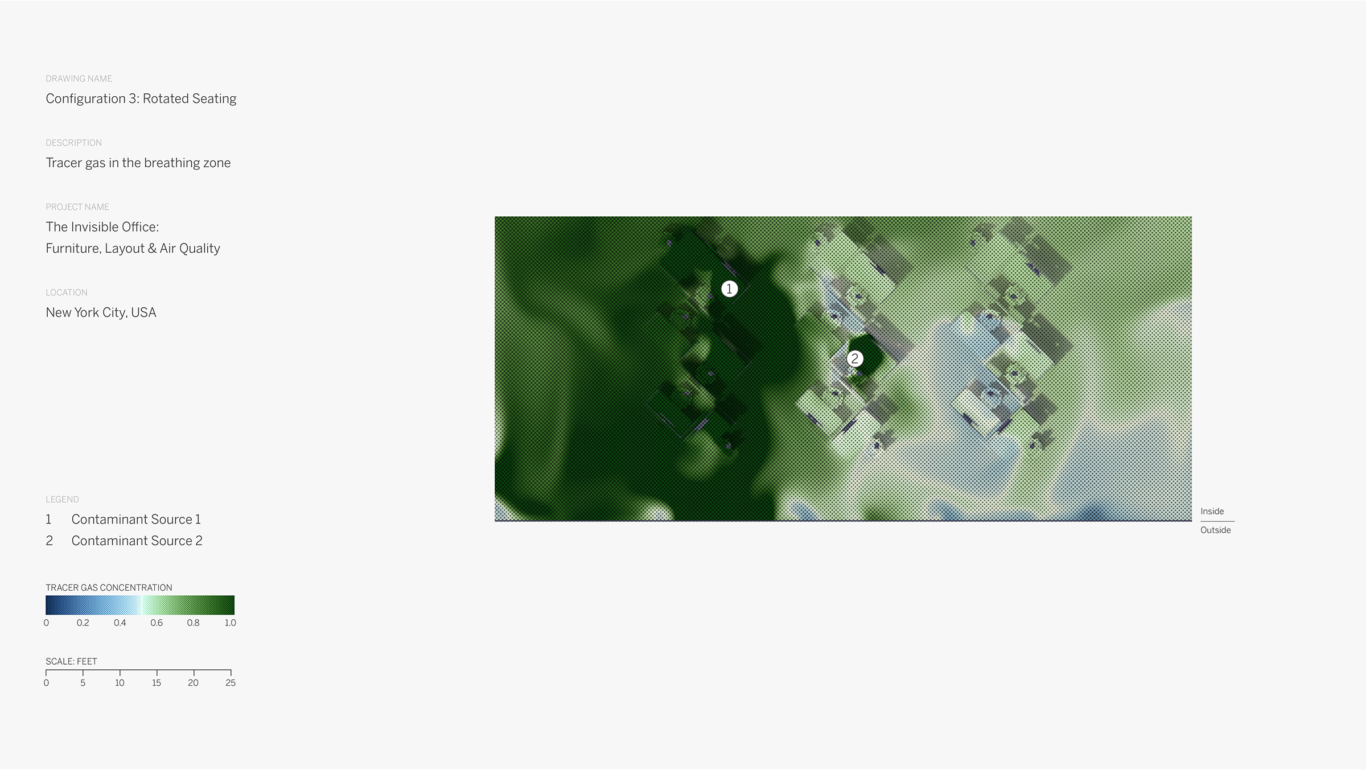
The COVID-19 pandemic has amplified public awareness about how indoor air quality can affect human health and wellbeing. Much of the recent focus on airborne virus transmission has spotlighted HVAC filtration systems and capacity of certain filters to purify air. But even when the highest filtration systems are used, a critical question remains: what happens to “infected” air between when it is emitted by someone carrying a virus, and when it is ultimately returned to the HVAC system?

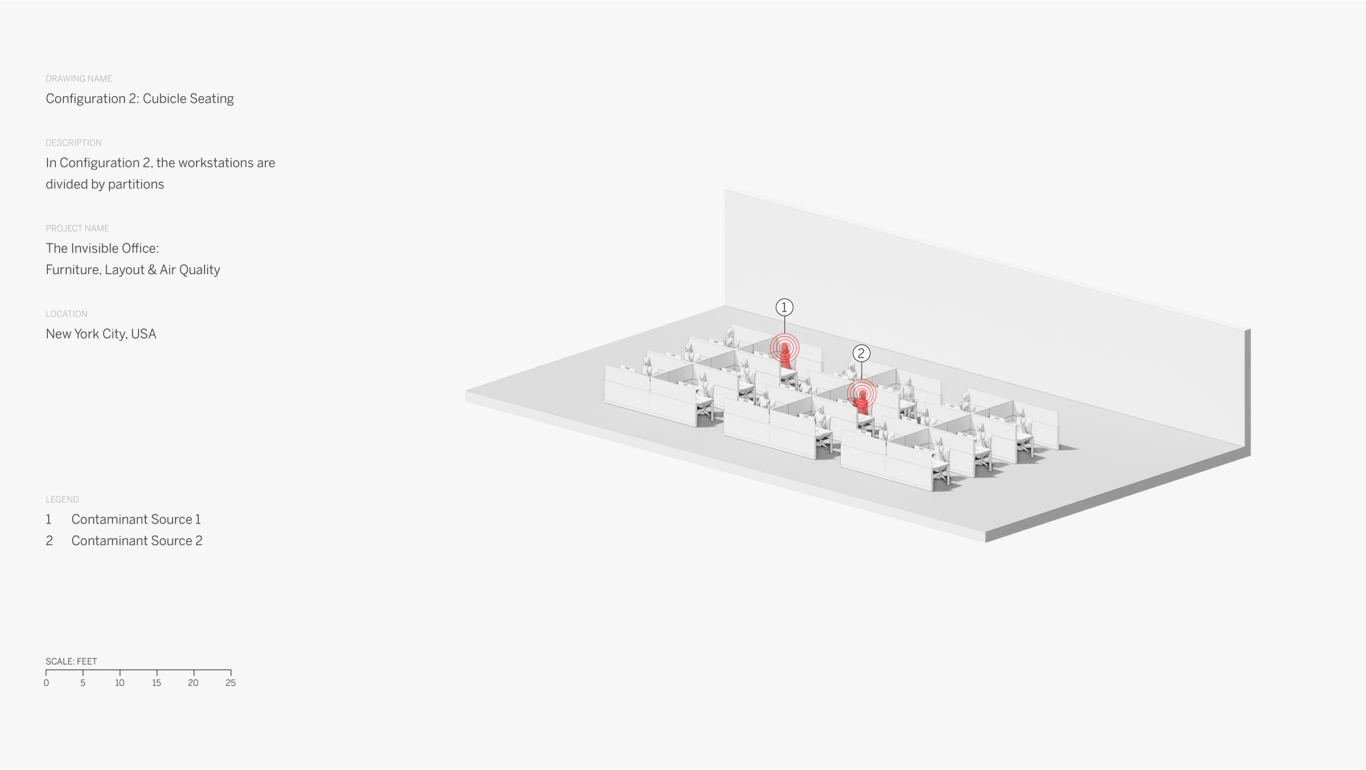
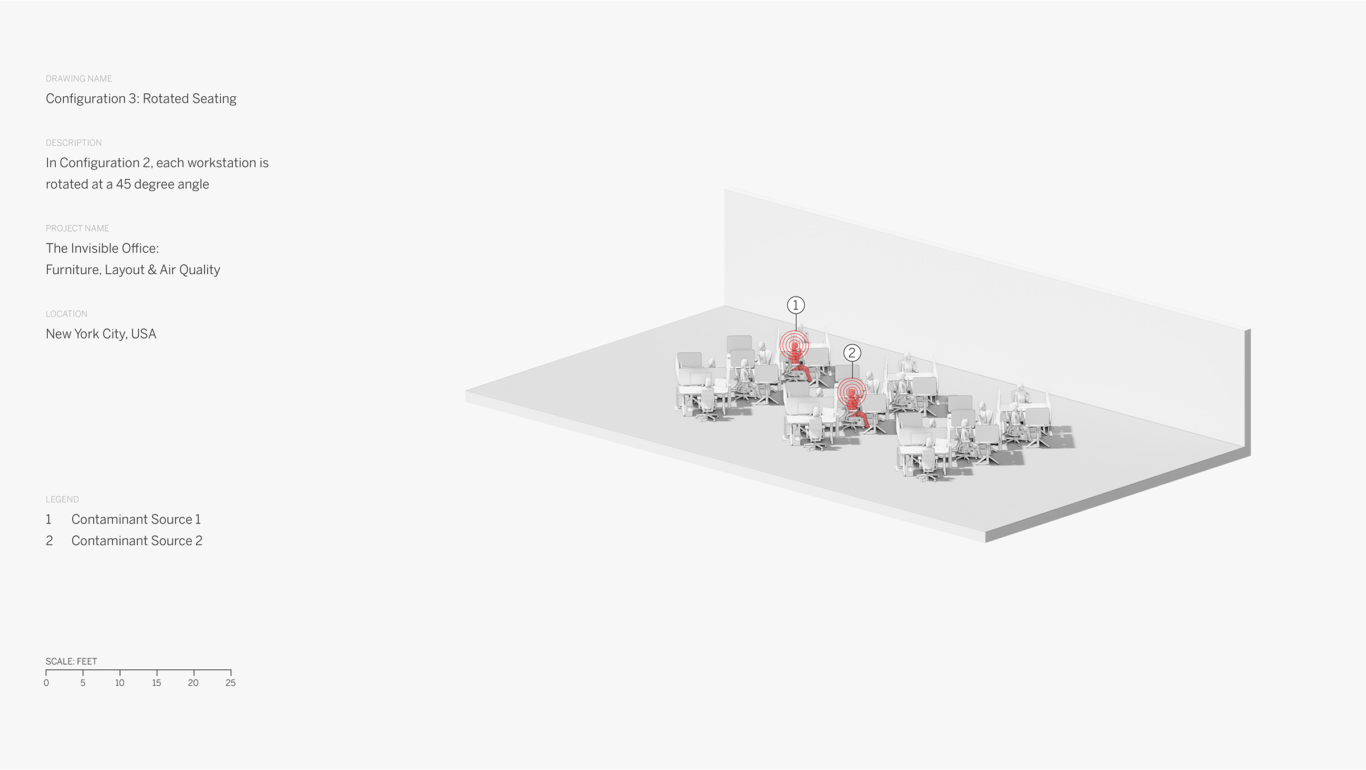
In 2021, we teamed up with Steelcase, a global leader in furniture and workplace solutions, to explore another essential and related question: What strategies can we employ in the design and layout of a typical office space in order to maximize indoor air quality and minimize health risks?


Understanding flows: a river of air

A simple metaphor can help us conceptualize the movement of air within a typical office space: a river of air. The configuration of an HVAC system involves organizing the supply vents along one side of a space, and the return vents on the opposite end. In the natural state of the space, this sets up a reliable, even flow of air in one direction.

Air Quality
© SOM

Similar to an actual river, as soon as objects (people, furniture, plants) are placed within the zone of airflow, they have a meaningful impact on the pattern of movement of the air. These objects can impede airflow and create zones of stagnant air.

Air Quality
© SOM

When people who carry an airborne virus breathe within this space, aerosols enter the air stream and spread. When objects within the space create zones of stagnant air, these areas can impede air filtration.

Air Quality
© SOM
Air Quality
© SOM

Modeling layouts, mapping airflows

To examine how typical office layouts can improve or diminish air quality, our team used Computational Fluid Dynamic Modeling (CFD). This advanced digital modeling and analysis method allowed us to visualize airflow scenarios for three distinct office configurations: row seating, cubicle seating, and rotated seating.

We based our model on a common large-scale office floor plan measuring approximately 40 feet from the core to the outside perimeter wall (also known as the lease span), with 10-foot ceilings. A similarly common mechanical system is used, a Variable Air Volume (VAV) system that supplies varying amounts of air at varying temperatures, which is used in a majority of office buildings in the United States. [1]

We used two metrics to evaluate each furniture layout. “Age of air” measures how long air remains in a particular space, this can help illustrate how effectively air is changed within that space. A high age of air indicates stagnant air that is not circulating well at that location, whereas a low age of air indicates the air is being replaced by new air more frequently and the space is thus better ventilated. 

While age of air helps evaluate the effectiveness of ventilation systems, it does not necessarily reveal any direct impact on potential transmission of SARS-CoV-2. To more accurately understand how aerosols from a potentially infected individual may travel to neighbors and thereby infect them, we also used trace gas to simulate airborne transmission. Several representative occupants were modeled to release tracer gas, which was then tracked throughout the space to show how their exhaled air interacted with neighbors. [2]


Design guidelines for a healthy workplace

Our CFD modeling studies helped us to verify several key considerations to take into account when planning an interior space.

First, it’s important for building owners and users to understand the building’s ventilation system, including the location of HVAC supply and return vents, and to organize the space to work in harmony with that system. The best air quality is often closest to the supply vents, so that is a good location for workstations where people will be spending long periods of time. 

Second, it is essential to consider how objects and furniture can impact the natural airflow within the space. For instance, while partitions can contribute to a perception of safety, they may have the opposite effect as intended: creating zones of stagnant air. We found that a more open configuration that aligns furniture and partitions in the direction of airflow is a better choice in terms of air quality. 

Steelcase
© SOM

Some furniture-based interventions to promote healthy indoor air can have a minor impact, such as small desk fans and air-purifiers that don’t have capacity to move large amounts of air through space. Likewise, passive air filtration without mechanical power may not move the needle as much as a dedicated building systems. 

Finally, we recognize that air quality is just one factor to consider in the layout of a workspace. Comfort, efficiency, capacity, and budget considerations all must be taken into account. Every space is different, and there is no one-size-fits-all solution. By using methods such as CFD analysis, together with a careful assessment of each building’s mechanical and ventilation systems, we are equipped to help companies develop tailor-made workplace solutions that prioritize health and well-being.

Air Quality
© SOM

Notes

  1. Although each furniture and occupant layout changed, the overall setup of the simulation was constant. Each simulation was done using the HELYX (OpenFOAM) CFD software, and was run as a steady-state simulation with the k-w SST turbulence model. The overall mesh count was 1,223,933, and the smallest mesh size was 0.0125 Meters.

    The total number of diffusers and lights was also constant between each layout. There was a total of two return diffusers, modeled with 0 gauge pressure, and two interior supply diffusers, which each supplied 575 CFM at 71.3°F. Additionally, there were five linear diffusers along the South wall that supplied 345 CFM at 71.3°F each. The ceiling, floors, and walls were all set to a fixed temperature of 75°F, and the six lights were modeled with a power density of 7 W/sm of floor area and a light density of 52 W/sm of simulated light.

  2. The occupants in the space were modeled with a power density of 75 W each, and their breathing rate was assumed to be 1.6 CFM at 59 FPM and 98.3°F. Each laptop in the space was also accounted for and assumed to have a power density of 35 W.

More Research

01/